Uday
Kumar.
Propeller - Shore Portal
Redesigning the old landing page to RBAC landing page to support multiple stakeholders.

Company
MISC Group
Users
-
Superintendents
-
Procurers
-
PMO's (Project Management Office)
Product
Propeller - Shore Portal
My Role
Product Designer (UI/UX)
Type
Inventory Analysis
Desktop Application
Timeline
24 Weeks
The Team

Background & Context
Propeller Shore Portal is a dashboard designed to manage and monitor spare parts required for vessel operations. It provides visibility into inventory stored on board vessels and in onshore warehouses.
The platform tracks the lifecycle of spares from procurement through purchase orders to final consumption via work orders. This helps superintendents, procurers, and PMOs monitor inventory movement and manage maritime logistics more efficiently.
My Role & Responsibilities
As the Product Designer, I was responsible for understanding stakeholder needs and designing a dashboard that improves visibility into inventory, procurement, and operational data. My key responsibilities included:
-
Collaborating with superintendents, procurers, and PMOs to understand their workflows and information needs
-
Identifying usability gaps and data visibility challenges in the existing system
-
Defining the information architecture and dashboard structure
-
Designing intuitive and user-friendly interfaces for data visualization and reporting
-
Iterating on designs based on stakeholder feedback and business requirements
" The project is vast since i have re-designed whole dashboard, for this case-study i will only talk about dashboard landing page. How we have decided to have a RBAC landing page, The decisions taken while designing it and finally the impact it created."

Let's Jump-in
Exploring Dashboard Landing Page
I have started by exploring the dashboard to understand what we have in it, How it is useful for our stakeholders/prime users and how does it impact the business decisions.

Mapping of The Dashboard Landing Page
After through scanning of landing page i have mapped what information is on the dashboard landing page and noted gaps and opportunities.

Primary users of dashboard
Superintendents 👮🏻♂️
Superintendents oversee vessel operations and rely on the dashboard to monitor inventory levels, track critical spares, and review vessel spending against allocated budgets to ensure operational and financial efficiency.
Procurers 📦
Procurers manage the procurement process by tracking purchase orders, monitoring spare deliveries, and ensuring that required parts are available on time to support vessel operations.
PMOs (Project Management Office) 📊
PMOs use the dashboard to monitor system performance and transformation progress. They track system uptime and downtime, oversee data integration between ship and shore applications, and monitor overall platform usage and operational activity.

David O'Connor
Role: Fleet Superintendent
Experience: 12+ years in maritime operations
Goals
-
Monitor vessel inventory and critical spares
-
Track vessel spending against allocated budgets
-
Ensure vessels have required parts during voyages
Frustrations
-
Lack of visibility into inventory levels across vessels
-
Difficulty tracking procurement status
-
Delays in generating operational reports
Needs
-
Clear view of spares availability
-
Budget vs spending insights
-
Real-time operational data

Harry Wang
Role: Procurement Manager
Experience: 8+ years in supply chain & maritime procurement
Goals
-
Manage purchase orders efficiently
-
Track spare deliveries to vessels
-
Ensure critical parts are procured on time
Frustrations
-
Manual tracking of purchase orders
-
Limited visibility into spare requirements
-
Delays in procurement updates
Needs
-
Easy purchase order tracking
-
Visibility into required spares
-
Clear procurement workflow

James Wilson
Role: Project Management Office (PMO) Lead
Experience: 10+ years in enterprise system management
Goals
-
Monitor system performance and usage
-
Track transformation initiatives
-
Ensure smooth integration between ship and shore systems
Frustrations
-
Limited visibility into system activity
-
Difficulty tracking platform usage and performance
-
Lack of consolidated operational insights
Needs
-
System uptime & downtime monitoring
-
Application usage insights
-
Integration status visibility
Key Challenges Identified
-
Limited visibility into inventory levels made it difficult for stakeholders to track critical spares across vessels and warehouses.
-
Fragmented operational and financial data prevented superintendents from easily monitoring vessel spending and procurement activities.
-
Heavy dependency on developers for generating reports slowed down analysis and decision-making.
-
Lack of consolidated insights across ship and shore systems created inefficiencies in managing maritime logistics and operations.
Problem Statement
The dashboard lacked clear visibility into key operational data such as inventory levels, procurement status, and vessel spending. Superintendents, procurers, and PMOs found it difficult to access consolidated insights required to manage maritime logistics efficiently.
As a result, stakeholders often relied on manual reporting and external support to retrieve the required information, which slowed down analysis and delayed operational decision-making.
Design Goals
-
Create a centralized dashboard for inventory, procurement, and operational insights
-
Enable self-service reporting to reduce developer dependency
-
Improve visibility into spares, spending, and purchase orders
-
Provide role-based insights for superintendents, procurers, and PMOs
Data Metrix
I have listed and segregated the data points according to stakeholders which are showing on the old dashboard and also the possible options which may be importent for developing new dashboard landing page.

With the all intel gathered and the understanding of the challenges faced by our stakeholders when using dashboard
Jumping into "Design"
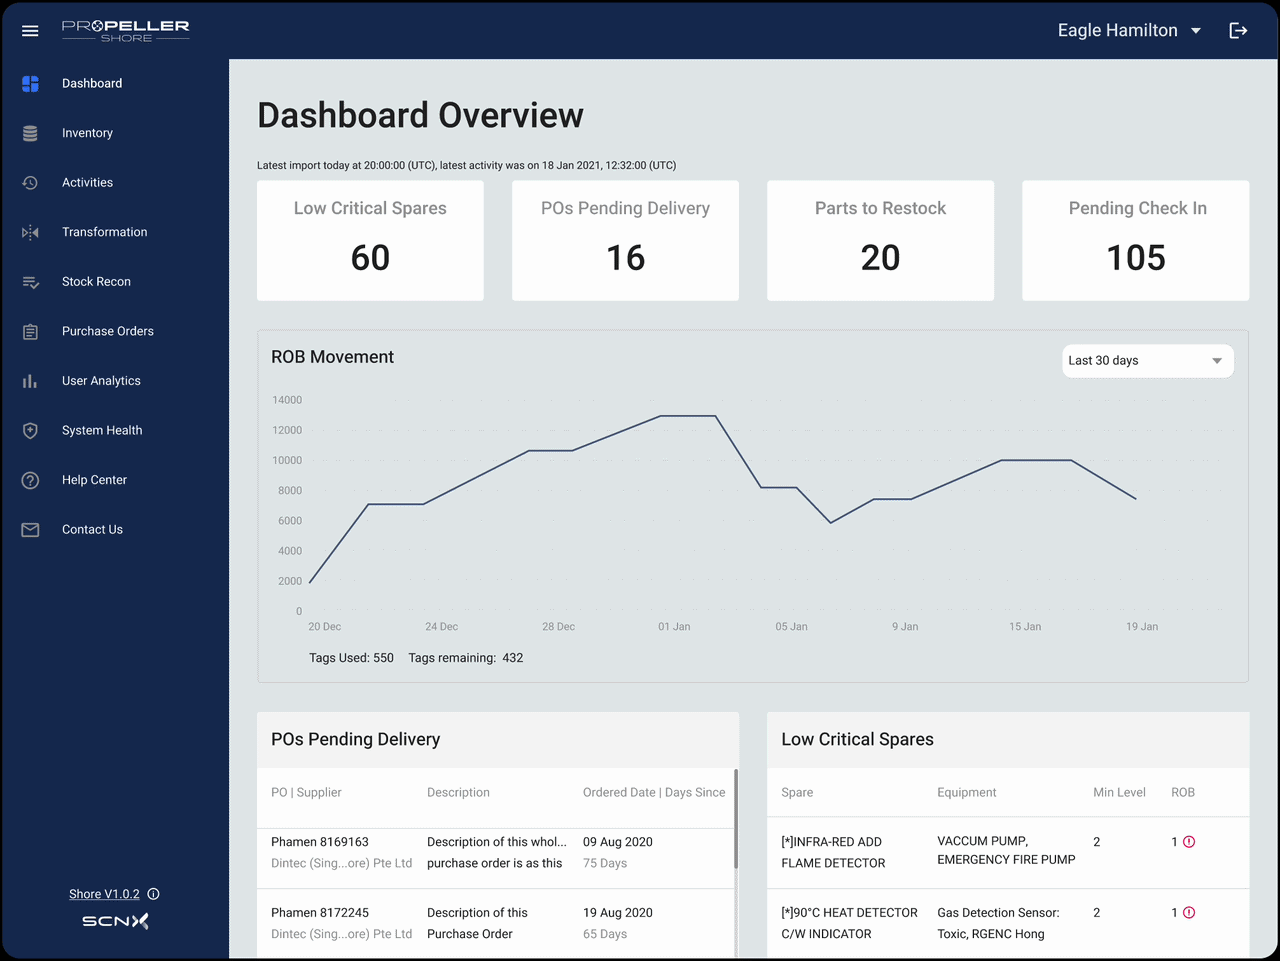
1. Superintendents Landing Page
I have started the iteration with the help of key insights which i have got from the interviews and while testing the landing page.
1A. Iterations


1B. Final Design


2. Procurers
landing Page
I have started the iteration with the help of key insights which i have got from the interviews and while testing the landing page.
2A. Iterations
2B. Final Design


3. PMO's
landing Page
I have started the iteration with the help of key insights which i have got from the interviews and while testing the landing page.
3A. Iterations
3B. Final Design


Impact on Business and Operations 💼
60%
Reduced developer dependency by 60% through self-service reporting and real-time visibility.
50%
Cut data consolidation time from 48/72 hours to instant access, improving decision speed by ~50%
$
Enabled proactive budget control with clear spend vs. allocation insights across vessels.